In this session, we all learnt how to conduct a survey professionally.
Survey is basically some statistics that is put together through questionnaire, and is then visually represented in different forms. It can also be called as a field of applied statistics.
Following are the type of questionnaire one can ask in order to conduct a survey i.e., to collate the data and put it together through visual representations :-
- Basic Information –
- Name
- Age
- Locality
- Occupation
- Awareness –
- type of question that would tell you whether the person is aware of the issue or not. If yes, what do they know about it.
- you can ask them their opinion on the topic.
- Do they identify it as a problem
- Daily life related questions –
- this includes about what do they do in their daily life that somehow, directly or indirectly contributes towards the issue.
- Their contribution on a larger extent
- Their feedback on the issue
- Impact of whatever they have done or seen.
These question are not to be asked directly, there are types to do so:-
- Objective questions (yes/no)
- Rate questions (0-10)
- Choices (any number of choices)
This would make it easier for you to collate the data/statistics later.
Now, after the answers the above questionnaire are found, they need to be represented visually. There are different ways of representing these statistics :-
- Bar graphs
- Pie charts
- Histograms
Following are the questionnaire that me and my group listed down for Zero Hunger Survey.
Basic Information –
1. Name : __________
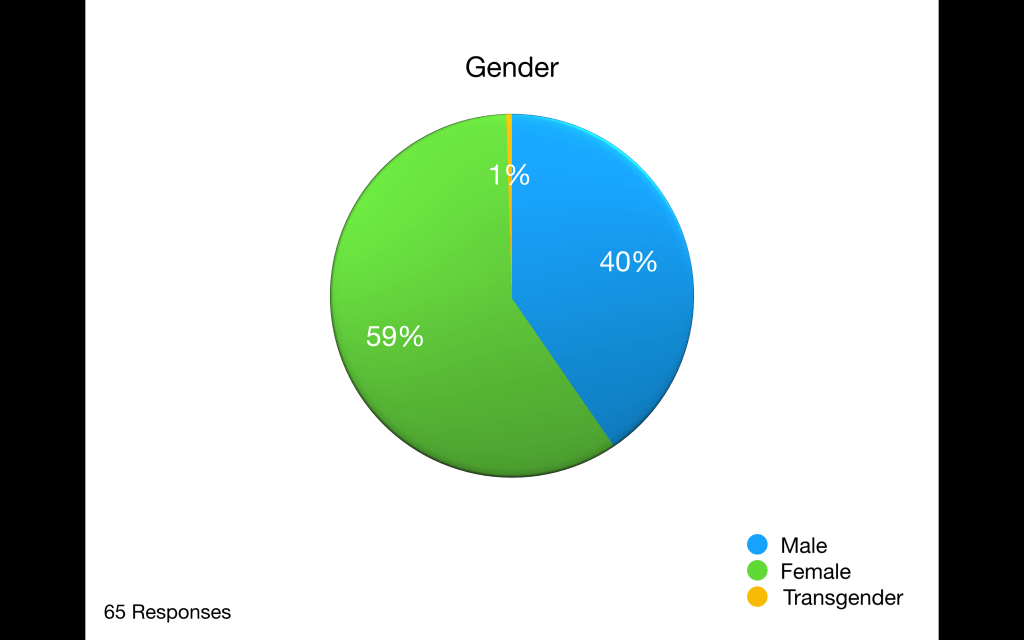
2. Gender :
- Female
- Male
- Transgender
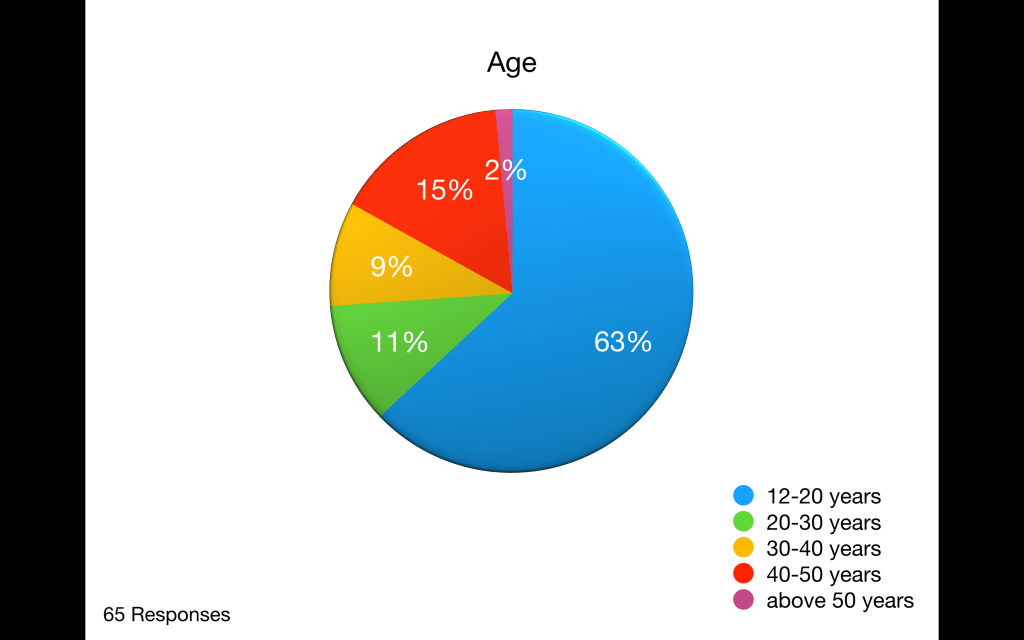
3. How old are you?
- 13-20 years
- 20-25 years
- 25-30 years
- 30-40 years
4. Which area do you live in?
- Residential
- Commercial
- Both
Awareness and whether they identify it as a problem –
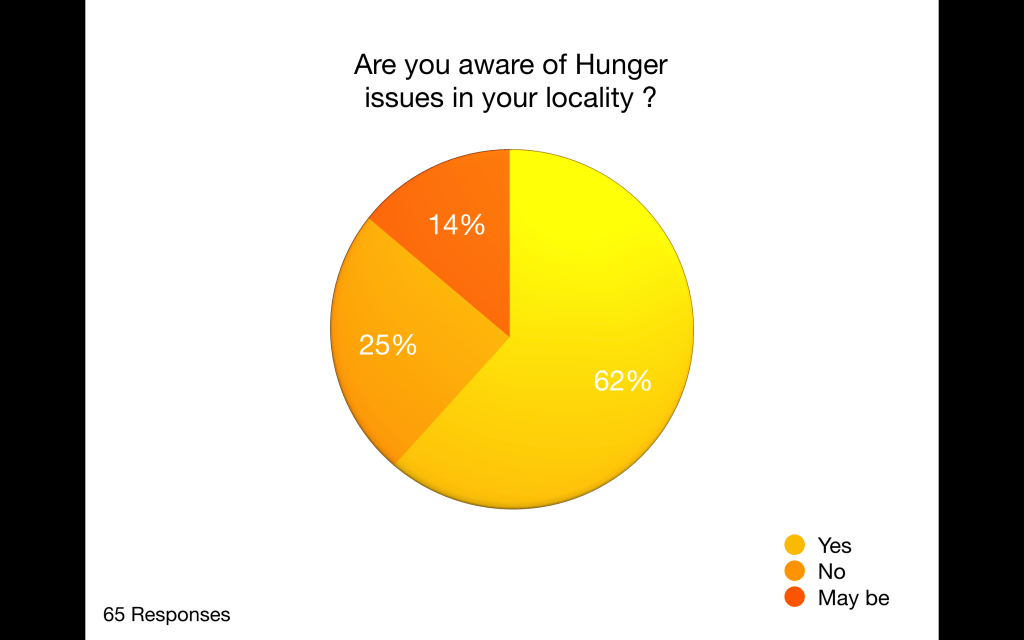
5. Are you aware of this issue?
- Yes
- No
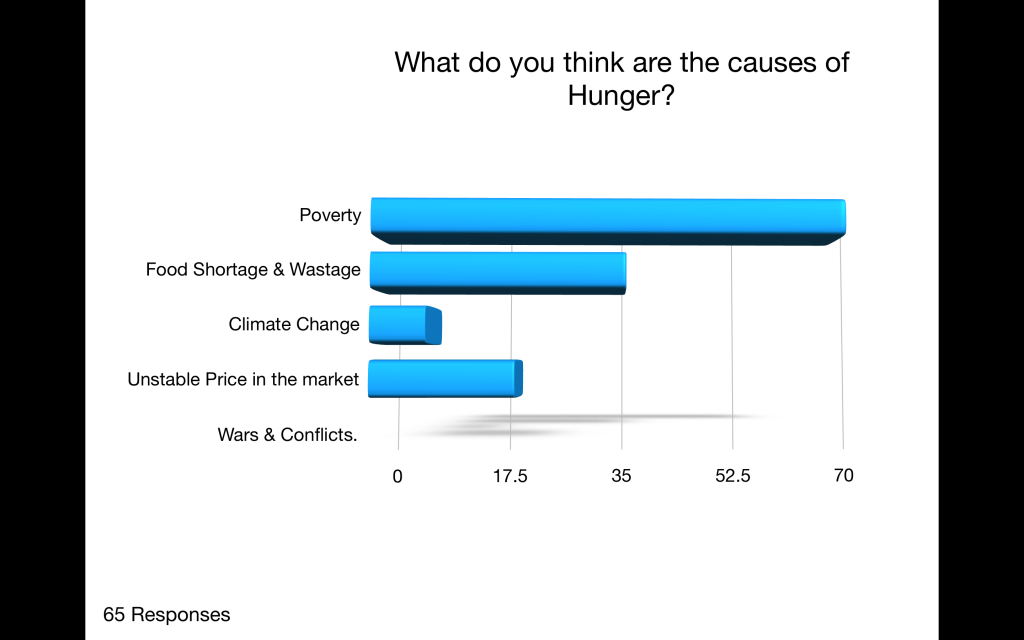
6. What do you think are the causes of Hunger?
- Poverty
- Wars and Conflict
- Food Shortage and Wastage
- Climat Change
- Unstable Prices in the market
7. Do you think hunger in your locality is an issue and it must be resolved?
- Yes
- No
Daily Life –
8. Do you take any initiatives at your home level?
- Yes
- No
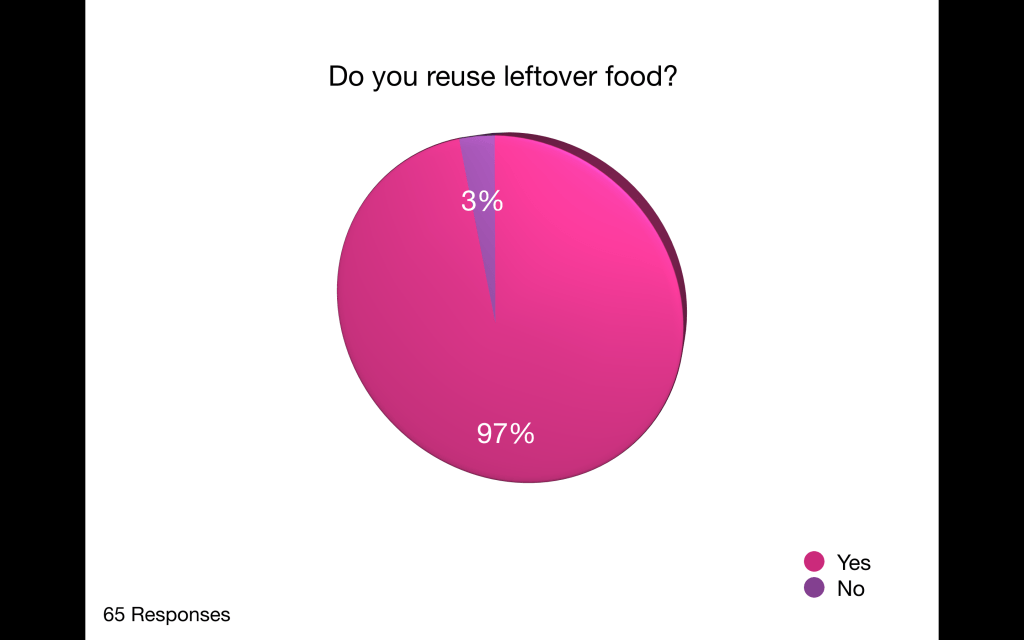
9. Do you reuse left over food?
- Yes
- No
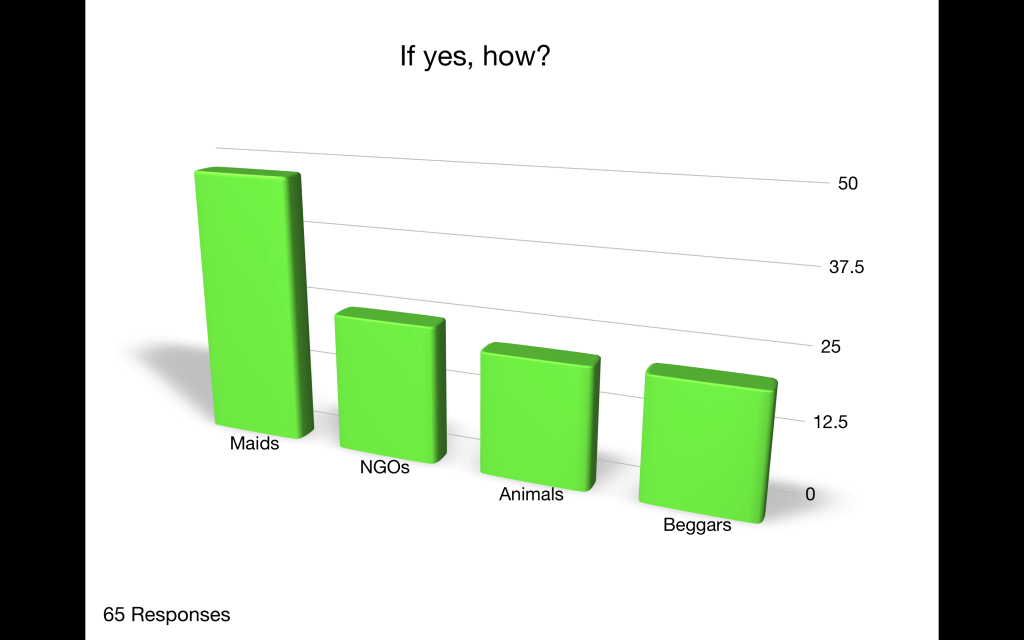
10. If yes, how?
- Maids
- NGOs
- Animals
- Beggars
- Others : ________
11. How often do you waste food on an average?
- Daily
- Twice a week
- Thrice a week
- Twice a month
- Thrice a month
12. What kind of food is wasted the most at your place?
- Rotis
- Canned food
- Cooked food
- Fruits and veggies
- Other : ________
13. What motivates you to avoid wastage of food?
- For the environment
- Saves money
Their contribution/non-contribution – 14. Do you donate food?
- Yes
- No
15. If yes, how many times a month?
- Once
- Twice
- Thrice
16. Have you ever wasted food somewhere or. witnessed wastage of food?
- Yes
- No
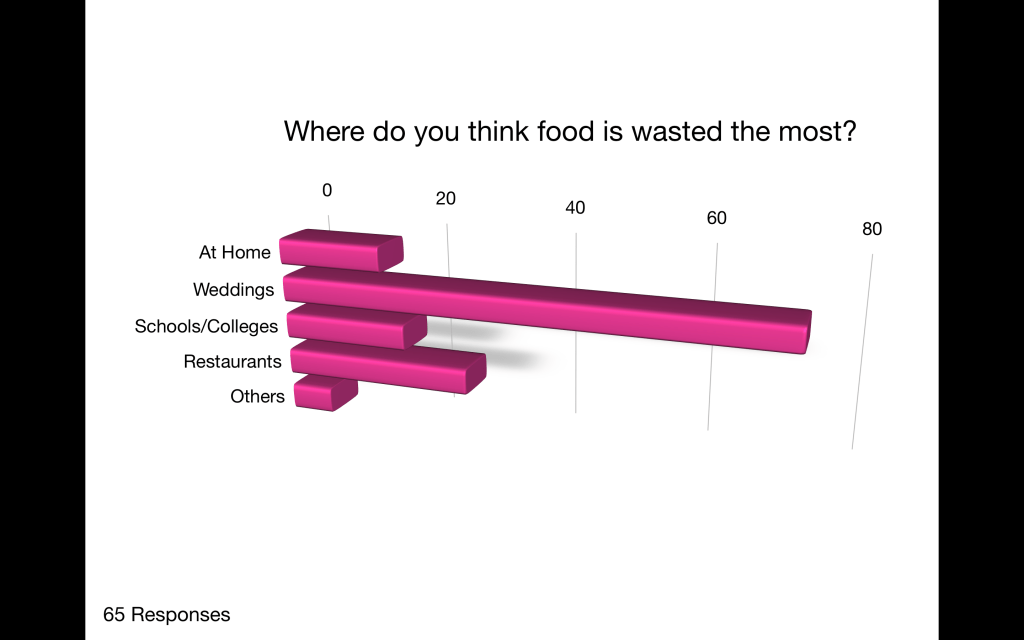
17. If yes, where?
- Home
- Weddings
- School/Canteen
- Malls
- Other : ________
18. Have you done anything else before that could help reduce Hunger?
- Yes
- No
19. If yes, what have you done?
(subjective)
Impact –
20. Was the impact of it positive? (subjective)
Feedback –
21. What do you think about No Hunger Campaign? (Subjective)
->Assignment – List down the questionnaire based on the topic assigned to you, conduct a survey in Residential and/or Commercial areas and visually represent your data separately for each.
Micro-Level Study (Residential)